Audit Dashboard
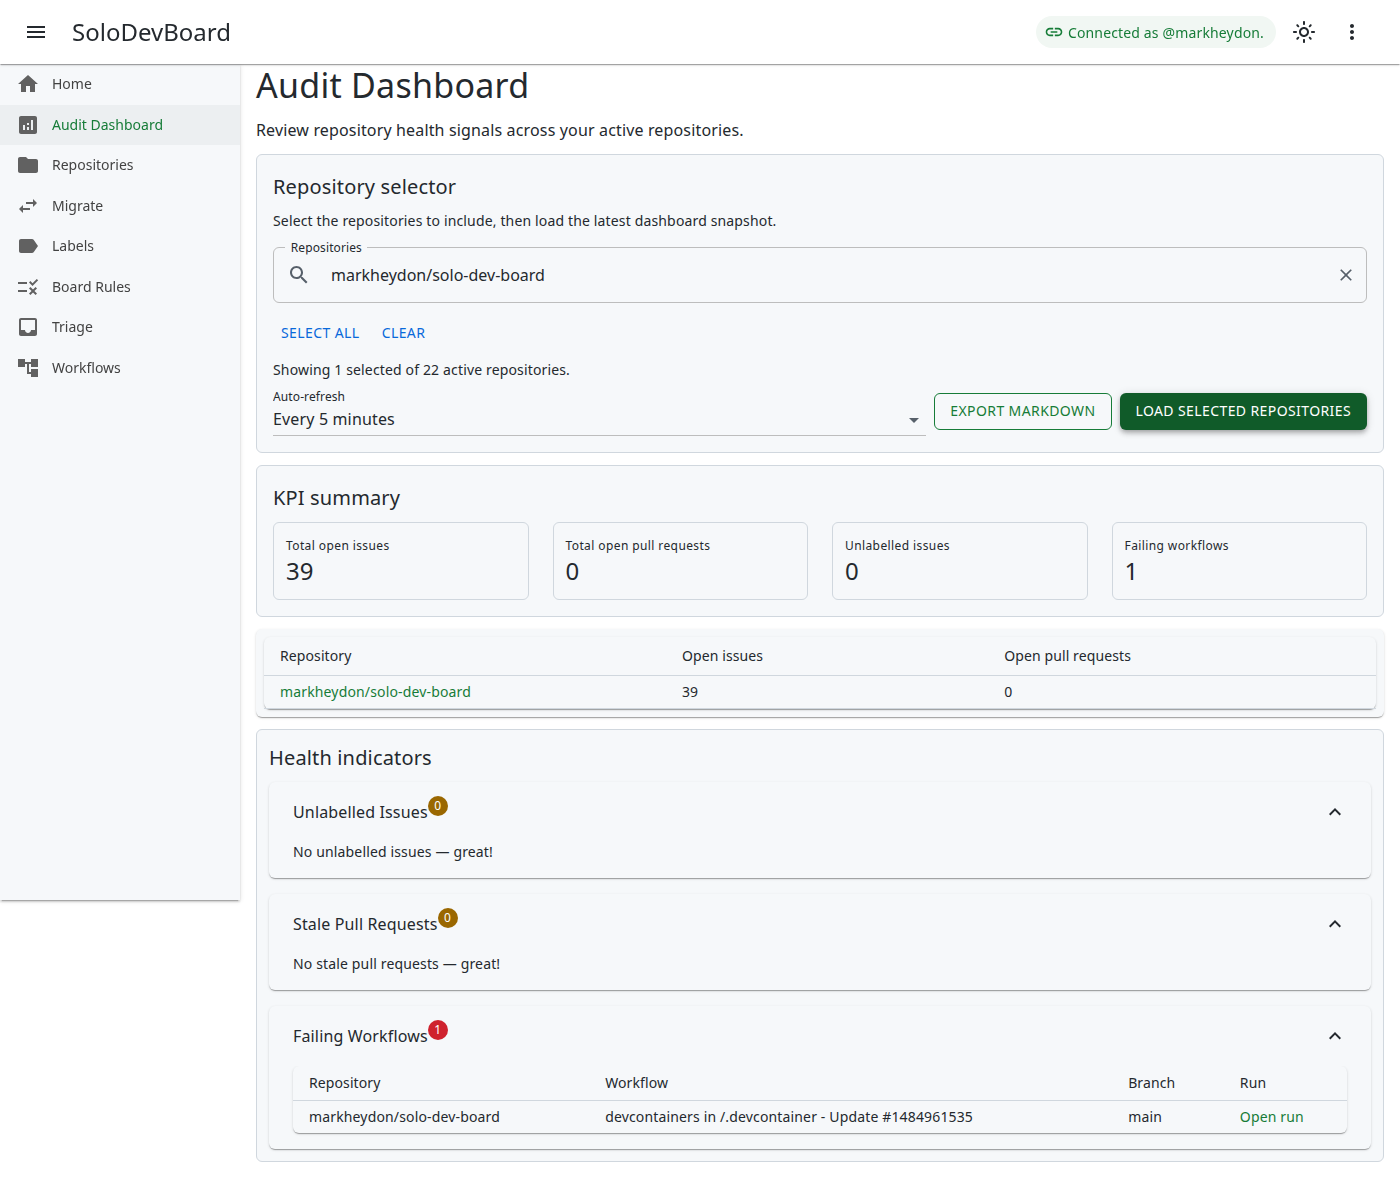
The Audit Dashboard summarises open issues, open pull requests, and repository health across the repositories you select.
Accessing the Audit Dashboard
- Open Audit Dashboard from the app home page or the left navigation.
- The route is
/audit-dashboard.
Features
- Choose one or more active repositories with the repository selector before loading data.
- Choose Reload from GitHub in the repository selector header to refresh the catalogue and audit snapshot without clearing your repository filter.
- Review a sortable summary grid with repository name (linked to GitHub), open issue count, and open pull request count.
- KPI summary cards show total open issues, total open pull requests, unlabelled issues, failing workflows, and label consistency warnings for the selection.
- Health sections cover unlabelled issues, stale pull requests, failing workflows, and label consistency, each with a badge count and expandable detail.
- Loading, empty, error, and prompt states appear in a consistent feedback region.
- Auto-refresh can be set to off, every 1 minute, every 5 minutes, or every 15 minutes (default: every 5 minutes).
- Export Markdown copies the current audit summary to the clipboard, respecting the selected repository filter.
- Links in health sections open in a new browser tab.
How to use
Open the dashboard
Open the Audit Dashboard from the app home page or navigation menu.
Select repositories
Search and select the repositories you want to audit. Use Select all to include every active repository, or Clear to reset the selection.
Load audit data
Click Load selected repositories to fetch audit data.
Review summary and health
Review the summary grid and KPI cards. Expand health sections for unlabelled issues, stale pull requests, failing workflows, and label consistency.
Optional refresh and export
Optionally set Auto-refresh to keep the summary up to date. Click Export Markdown to copy the current summary for planning notes.
Change the selection
To change the repository set, adjust the selector and load again.
Label consistency
Label consistency compares each selected repository against the SoloDevBoard canonical taxonomy used by Label Manager:
- Missing — a taxonomy label is not present in the repository.
- Divergent — the label exists but its colour or description differs from the taxonomy.
Extra labels that exist only in the repository are not reported. Use Label Manager to apply the taxonomy.
Empty states
When a health category has no items, the dashboard shows a positive empty-state message, for example:
- “No unlabelled issues — great.”
- “No stale pull requests — great.”
- “No failing workflows — great.”
- “Labels match the SoloDevBoard taxonomy — great.”